
Best Practices | Helpful Tools
Well-organized spreadsheets, sometimes referred to as “tidy data,” make data analysis and visualization significantly easier and save the researcher time. Use these best practices when setting up your spreadsheet and inputting your data and you will spend less time cleaning and re-organizing your data later.
In addition to the recommendations on this page, creating a data dictionary can help as well. See our information about data dictionaries for specifics.
Each recommendation below is numbered. See corresponding examples of “messy data” in the images that follow, as well as the “tidy data” example at the bottom of the page.
 Make your Spreadsheet a Rectangle
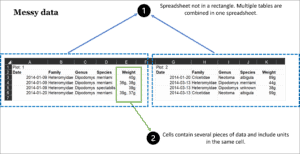
Use only simple rows and columns for data so the spreadsheet is a single rectangle. Don’t have multiple tables on one spreadsheet and don’t add graphs, images, etc. on the same sheet. Instead use one table on each spreadsheet, with columns as variables and rows as observations.
 Put One Piece of Information in a Cell
Don’t put more than one thing in a cell; it makes sorting and analysis difficult. Put each data point (even measurement units) in separate cells or provide the units in the column heading and offer a definition in your data dictionary. If you need to make notes about data in a specific cell, create a “notes” column in your spreadsheet.
 Be Consistent with Variables
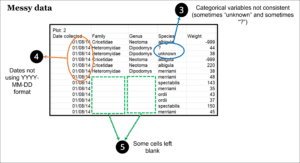
When entering data, be consistent with how you enter variables into the spreadsheet. For instance, always use “male” for male, rather than sometimes using M, m, or Male.
 Watch the Date Format
Use the date format YYYY-MM-DD (also known as ISO 8601 ) or use separate columns for Year, Month, and Day. This reduces confusion for an international audience and avoids problems with how Microsoft Excel treats dates. (More information about formatting dates in Excel can be found in the support documentation on their website. )
 Fill in all Cells
There are different schools of thought on how to treat missing data (see Broman & Woo and Hook, et al articles linked at the bottom of the page for more info). In general, best practice is to use a common code for missing data, such as a hyphen (–) or NA, to make clear the data is missing rather than unintentionally left blank. Don’t just leave the cell blank unless you define this in the data dictionary. Make a separate column for notes if you need to explain why data is missing.
 Avoid Special Characters and Extra Spaces
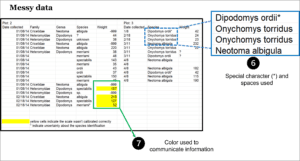
Special characters like @, *, and ^ mean specific things in programming languages, so using them in spreadsheets makes the data hard to work with later on. Similarly, spaces in column headings often require extra work when referencing them in programming scripts or code, so it’s best to use underscores to separate words (like_this) or use camel case (LikeThis).
 Don’t Use Colors, Fonts, Italics, or Visuals as Data
Colors, fonts, italics, and visuals are either ignored by the computer or just confuse it. It doesn’t know a bolded row is suspicious data, or a yellow row should be ignored. If you need to emphasize data to make it easier for a human reader, add another column with an indicator variable (e.g., “trusted” with values of TRUE or FALSE.)
Make Your Data Tidy
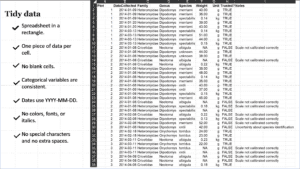
The image below shows best practices for spreadsheet data: it’s a single rectangle, there’s one piece of information in each cell, variables are entered consistently, date format is YYYY-MM-DD, missing data uses a common code, no special characters or extra spaces are used, and it doesn’t use color, font, or italics to communicate information.
Helpful Tools
OpenRefine
OpenRefine is a free, open-source tool for Windows, Mac, and Linux you can use to review and clean up (tidy) spreadsheet data, split or combine data columns, and insert linked data from other sources.
See the download and installation instructions here.
The Libraries provide individual, team, and class-based training on OpenRefine (request via lib-data@uiowa.edu)
REDCap
REDCap is a useful tool for creating and defining a data structure by basing it on a codebook or survey tool. Use REDCap for data entry for tabular data and surveys. It can be set up for HIPAA data and is frequently used for biomedical research.
REDCap is supported by the Institute for Clinical and Translational Sciences (ICTS). Request an account by emailing ICTS.
REDCap was created by Vanderbilt University. For more info, see their introductory videos.
References
If you’d like more information on best practices for organizing spreadsheet data, the following resources may help:
- (2018) Data Organization in Spreadsheets, The American Statistician, 72:1, 2-10, DOI: 10.1080/00031305.2017.1375989
- Hook L.A., Vannan S.K.S., Beaty T.W., Cook R.B., Wilson B.E. (2010) Best Practices for Preparing Environmental Data Sets to Share and Archive .
- Wickham, Hadley. (2014) Tidy data, The Journal of Statistical Software, 59:10, 1-23, DOI: 0.18637/jss.v059.i10
- (See this website for a shorter, less formal version of the paper above).
- Data Carpentry for Biologists